In the case when unspecified malfunctions of a system can incur large losses for business, it is important to understand which chain of events and uncritical failures can lead to them. Having the opportunity to maintain its position in the “working capacity” space relative to critical states, fatal consequences can be avoided.
Such systems can be both various technical processes and social agent systems, where administrative decisions are management decisions, and they can lead to failures.
Preliminary explanation
A significant part of this article has been taken from the various articles that have been written on the subject by me and a group of authors from LETI since 2012. Links to these articles can be found in the bibliography (and that’s not all of them). I can’t present here all studied problems in-depth, because they have been studied for 5 years and will not try. I’ll tell only about a small part of it — automatic construction of faults graph.
I want to express my gratitude to everyone who worked with me all these years. In particular, my supervisor, with whom I have worked since 2003 – Leonid Borisovich Poshehonov.
Statement of the problem and context
In 2012, my scientific supervisor called me and decided to talk about his unexpected fortune. He was asked to create a mathematical model of the semiconductors coating process and synthesize a control system (CS) which will guarantee the absence of failure in the main stage — coating itself. If you have problems at this stage a lot of expensive material becomes useless junk. There were no problem to create a mathematical models of processes, but control part created some difficulties. The process is separated in 13 dependent stages, each of which has its own CS and specific failures. However, despite all these difficulties, we’ve succeeded.
Within six months we’ve created control system which was paranoidly preparing for the main stage of the process. Thus, we’ve come to one of the most popular scientific and engineering community issues – “And what exactly we’ve done? Is it possible to generalize this approach? What is the connection of all this with the existing world experience in this matters?”
Some additional digging in the sources made it possible to characterize our model as a fault-tolerant hierarchical multistage control system. Quite original approach in its narrowness. A little bit about it can be found in this this article. However, it should be taken into account, that it is quite an old article, and formalization had updated a couple of times. Improved version described in this doctoral thesis (it can be somewhere here. Sorry, only in Russian).
My contribution to the final result has been rather modest. I’ve tried to rewrite the CS synthesis approach with mathematical symbols.
This article presents the specific part of the approach. It is mostly used during the synthesis of the lowest level CS, that uses data from control objects (CO) sensors. However, nothing prevents from using the same approach at the higher levels, and other time scales.
The essence of the approach is that the diagnostic system uses data from CO sensors to register the “symptoms” of faults in the current system and then proceed this “symptoms” to the Supervisor. Supervisor generate “diagnosis” and assigns “treatment” based of the “symptoms” data. This “treatment” control signal is then transmitted to the reconfiguration system, which rearranges the structure of the control object so that the system functionality restores. This process runs in parallel to the one that ensures that the system is doing something useful. Pretty simple.

F in the figure it all sorts of unpleasant external inputs and other things that can contribute to the emergence. Different S’s are different control objects, which are created by reconfiguration. This is basic description. No detail.
And in particular…
It is a truth universally acknowledged, that a people who start thinking how to build a fault-tolerant control system, must at first write down all the faults that may occur in system and ponder how these faults affect each other within the process. It is impossible to fully exclude human from this process, however several things which can be automated.
For example, we can automatically build the “diagnoses” graph, which will be the basis of the supervisor functioning. Supervisor can use this graph to determine which action will help to avoid the fatal consequences.
Some requirements and limitations
As with any method, this has a number of restrictions and requirements. Here they are:
- We have a set of N potential failures.
- Fault appear randomly.
- One fault can appear only once.
- Following fault may occur only after the reaction of the system to a previous.
- Fault is diagnosed, if it was detected and identified (identified the unique index of the fault in the faults set).
- Problem recoverable if there is an action within reconfiguration system, which can restore the possibility of successful completion of the technological cycle.
- Fault is relevant if it can have an impact on the successful completion of technological cycle.
- Formation of a new COl as a result of a fault and / or reconfiguration can be interpreted as the arrival of CO in the new state.
- The arrival of another failure is accompanied by a reduction of resources for the diagnosis of potential remaining faults as well as system recoverability.
- It is assumed (is case when all faults are relevant) that only a couple of faults affect each other. This can be written for the triple fault :
expression means that combination of effects of the first and the second fault on the third is the same effect that comes out when first two faults have already occurred.
The algorithm
We define a fault as a set of three logical values:
,
where:
– the fault is diagnosable in the current system,
– a recoverable fault current system,
– failure is both recoverable and diagnosable in the current system, but it creates the possibility of undiagnosable fault.
Let the control system be designed for the flow of N faults. Then, at each moment the possibility of faults can be described by three vectors:
– vector of diagnosability of possible malfunctions,
– vector of recoverability of possible malfunctions,
– vector of relevance of possible malfunctions.
Here — relevance of j-th fault, — diagnosability of j-th fault, — recoverability of j-th fault. .
We define the state of the system after a certain fault as:
,
where – index of the current fault, H – vector of indices of all faults that happened before i-th.
The initial condition vectors diagnosability, recoverability and relevance in the nominal system .
To calculate the current values for the vectors, the resources loss matrix is introduced:
D, R, A — matrices of diagnosability, recoverability and relevance loss.
Each of these matrices is a generalized resource loss matrix. We can describe this kind of matrix as follows. Loss matrix X— is the matrix . i-th row of the matrix determines which elements of the vector x of dimension K must be updated after the i-th fault:
Where x’ — updated vector, Xi — i-th row of the matrix h – the set of indices of faults that has already occurred, “>” – element wise boolean function “greater” (inversion of direct implication).
Example:
Let
Faults with indices 1 and 3 has occurred — h = {1,3}. Then:
.
Thus, when we have the resources loss matrices for all three vectors and the initial state vectors, it is possible to construct a graph that presents the change of diagnosability, recoverability and relevance with this algorithm:
function BuildBranches(s){
branches = ∅; nH = {s.H,s.i};
rH = g(R,r_0,H); aH = g(A,a_0,H); dH = g(D,d_0,H);
for i = 1:N {
if(aH,i==0 || i ∈ s.H){continue;}
if(∧(dH ∨(!aH))==0) {s.θ=1;}
sn = {i,nH, dH,i,rH,i,0};
if(rH,i == 1){
if(s.H == ∅){
branches = sn; branches ← BuildBranches(sn); }
else{if(dH,i==1) {
branches = sn; branches ← BuildBranches(sn);}
else{branches = sn;}}}
else {branches = sn;}}
return branches;}
s0 = {0,∅,1,1,0};
S = BuildBranches(s0);
Variables — are nominal vector d0, r0, a0 (if it is suddenly not obvious), and all other global constants correspond to ones in the parameters description.
Dynamics in the process can be easily added by introduction of the faults conditional probability matrix over a period. Thus, the entire process can be also be simulated.
During the control system synthesis this simulation is not necessary, but it is important to keep in mind all possibilities. For example, we have an undiagnosable, but highly unlikely fault it might make sense not just to stop immediately, but use survival analysis to estimate the overall probability of failure by the end of some important technological cycle, which is difficult to roll back. However it depends on the specific system and its risks.
Example 1
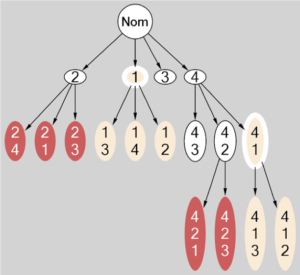
Suppose that there are 4 numbered malfunction. First malfunction makes other undiagnosable (e.g., defective sensor). The second failure causes the rest to become unrecoverable (e.g., the machinery which is responsible for faults recovery is broken). The third fault makes all other irrelevant (this, of course, cannot happen). Vectors r, d, a are unit vectors initially. The graph built by the algorithm for this setup is depicted below:

The nominal state of the system is the node — Nom. White nodes corresponds to states in which recovery is possible. Red tree nodes are non-recoverable, beige – undiagnosable. Beige with white rim — a state in which faults become undiagnosable. Red with a white rim – undiagnosable and not-recoverable fault (in this example they are not present).
Example 2
Let’s consider something funnier. For example, let’s build a graph of mistakes in personal life and the hierarchy of their recoverability.
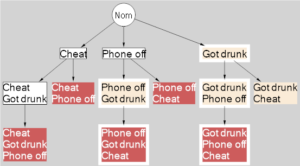
Suppose there are three mistakes that person can do on a Friday night. He can get drunk, cheat his wife and turn the phone off. By themselves, all mistakes are “fixable”. One can hide his cheat from wife, apologize for phone and put himself in a long boat till he’s sober (early in the morning). The problem arises when mistakes occur together.
If a person is drunk, he can not keep track of cheating. It will not be diagnosed. If person cheated and the phone was turned off, he will be busted and thrown out of the house. And vice versa. If he turned off the phone, and then cheated — the same result. It should be noted that this symmetry is not mandatory.
That’s what comes out:

The result is not so much of a moral standard, but practically useful. Boozing should be avoided, ‘cause it makes everything little bit unpredictable. However, if you got drunk, you must stop the party immediately and go home in order to avoid undiagnosable consequences. If you’ve cheated while sober, and then got drunk, it is necessary to monitor that the phone is always switched on.
If you look at the papers in bibliography, you find there more serious examples of technical system models, real objects, differential equations and so on.
Bibliography
- M Yu Shestopalov, LB Poshekhonov, AV Bespalov, SD Altshul, EV Guzayev, Development of the interactive systems with fault-tolerant control of complex objects, Soft Computing and Measurements (SCM), 2017 XX IEEE International Conference, p. 190-193.
- M Yu Shestopalov, LB Poshekhonov, AV Bespalov, Diagnostic algorithms for hierarchical fault-tolerant control systems, Soft Computing and Measurements (SCM), 2016 XIX IEEE International Conference, p.86-88.
- M Yu Shestopalov, LB Poshekhonov, AV Bespalov, Fault-tolerant control for the subsystem of nickel production process, Soft Computing and Measurements (SCM), 2016 XIX IEEE International Conference, p.89-93.
- LB Poshekhonov, AV Bespalov, M Yu Shestopalov, Decision making in fault tolerant control systems of technological processes, Soft Computing and Measurements (SCM), 2015 XVIII International Conference, p.37-41.
Author: Alexander Bespalov, Research Data Analyst, Maxilect
