Meaningful conversion reports make it a lot easier to optimize your advertising spends. One very effective way we’ve found to maximize ROI is by digging deep into what we call channel interactions. As you probably know, a marketing channel is a group of traffic sources combined into specific categories.
The most widely used channels include: organic search, direct email, and paid advertising.
When a user visits multiple channels within a campaign it creates a chain. Every user experience is different, so each user’s interaction can cross multiple channels in various orders. To measure the effect that different chain structures have on conversion rates, we use a metric we call channel interaction.
Our experiments have shown that when users only interact with a single marketing channel, conversion rates drop 80%.
We’ve also learned how you can raise conversion rates by excluding the least useful marketing channel. Later, we’ll also show you how to identify this channel.
The channel interaction attribution model
The attribution models you’ll find in Google Analytics often lack nuance, because most chains contain only one channel. “Last Click” can tell you if a specific channel is effective; however, it doesn’t reveal anything about the multiple channels that brought the user to the link.
However, by digging deeper to dissect the channel diversity within a single conversion, you’ll have a lot more data to optimize a specific chain.
For example:
Let’s say a user has touched two different marketing channels before making a purchase, we’ll call them channels A and B. The conversion rate for this chain will be different than if the user only clicked on channels A or B independently. Why? Our research shows time and time again that the more channels a user interact with, the more likely they are to convert.
To further illustrate our point, here are a couple graphs we’ve taken from actual campaign data.
Dataset parameters:
- Chain length: 4
- Number of used channels: 5
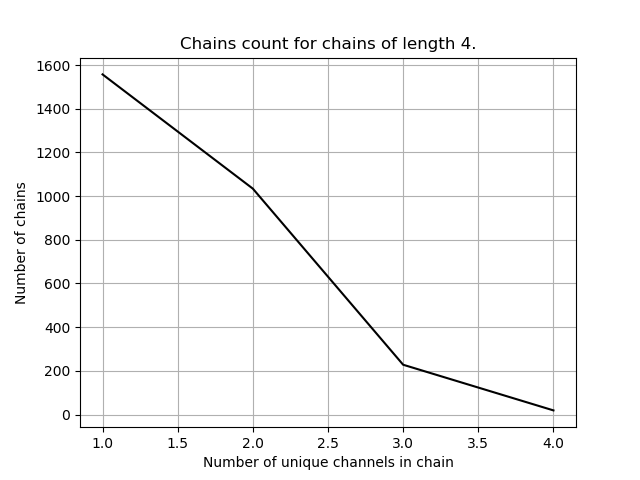
a) Number of unique channels in chain vs number of such chains
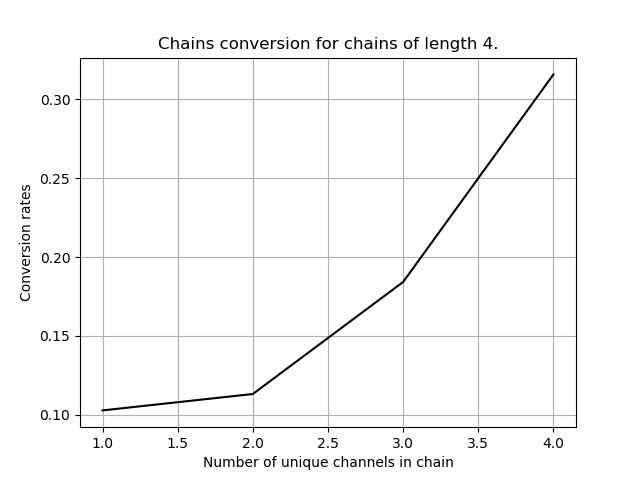
b) Conversion rate of chains with specific number of unique channels
Fig. 1.
The first graph shows the number of unique marketing channels found within a chain. The second graph shows how the conversion rate is dependent on number of unique channels in each chain.
As the number of unique marketing channels in a chain goes up, so does the conversion rate.
The graphs show that although chains with 4 unique channels are pretty rare, they convert 3 times more often than those with just 1 channel.
As these graphs show, taking a close look at the number of channels your users touch can have a major impact on your conversion rates.
Some ideas to think about:
- What percentage of your chains are uniform (multiple instances of the same channel)? The higher percentage of uniform chains, the lower your channel interaction.
- These metrics are best viewed on a graph, so you can clearly see how the channels interact.
Choosing the right channels for your campaign
The big question everyone asks is: “What marketing channels should we use to create the most effective combination?” While there are far too many variables to provide an absolute answer, a simple rule of thumb is: the more channels you use, the better. Then, after testing, you can determine which ones to remove from the mix.
We conducted an experiment to find out how channel interaction effects conversion rates.
We recently conducted an experiment that taught us a major lesson: by simply eliminating the channel with the lowest amount of interaction, conversion rates rose from 1.58% to 2.1%. The experiment was conducted under the assumption that marketing expenses were equal across channels.
However, the one drawback is that if the low-interaction channel is a popular platform, like Facebook, eliminating it may result in a loss of customers across the board. That’s because these big platforms often have low ad engagement, but high impressions.
The most popular channels also tend to have the lowest conversion rates, so we decided to normalize the data by using impressions as opposed to click-to-conversion as to determine their effectiveness. This was also done assuming each channel costs the same.
When comparing channels with varying costs, we divided conversion rates by channel costs to gage their true efficacy. When we excluded two of the lowest performing channels in our campaign, the overall conversion rate dropped 1.58% to 1.54%. However, the expenses went down by 28.9%, thus leading to a 28% decrease in cost per click.
So, a drop in conversation rate doesn’t necessarily mean you’re wasting any ad dollars. (Overall effect is dependent on input variables for ROI calculation for a given product of value X.)
Some general rules to consider when using channel interaction metrics:
- Don’t artificially pump up your channel interactions by inserting unnecessary links. This can make it harder to effectively judge their interaction.
- If a channel does not interact with any other channel, get rid of it.
- A/B test to figure out why users are making a particular interaction. Good testing can show your campaign is headed in the right direction even without generating actual conversions. When interaction increases, you know your campaign is operating correctly.
- Don’t just stick to one analytical tool, even if it is clearly works best. Diversifying your methods always improves results.
Further evidence
An experienced data analyst will try to tell you that that the concept of channel interaction is simply clever data manipulation. They’ll say that a diverse channel is more effective only because of the presence of a high-performing channel in a chain, not because of the interactions.
However, they’d be wrong.
Evidence 1
To prove the point, here are two graphs from the same datasets. This time we will focus on specific chains. We have two chains that both have 4 advertising channels. The first graphic shows the number of touches each channel receives. The second graph shows how each specific channel converts.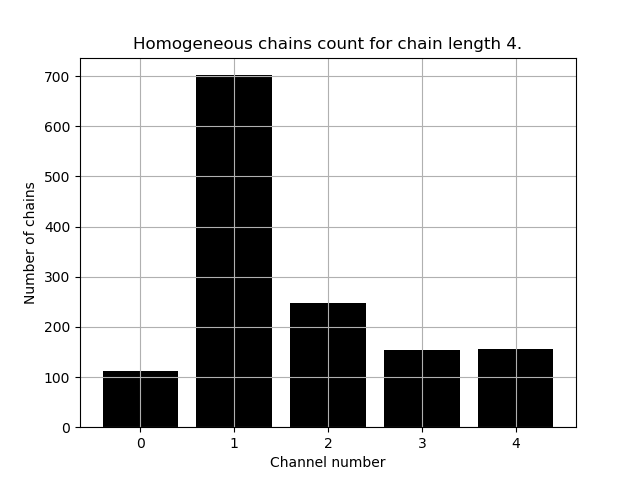
a) Number of homogeneous chains of specific channel
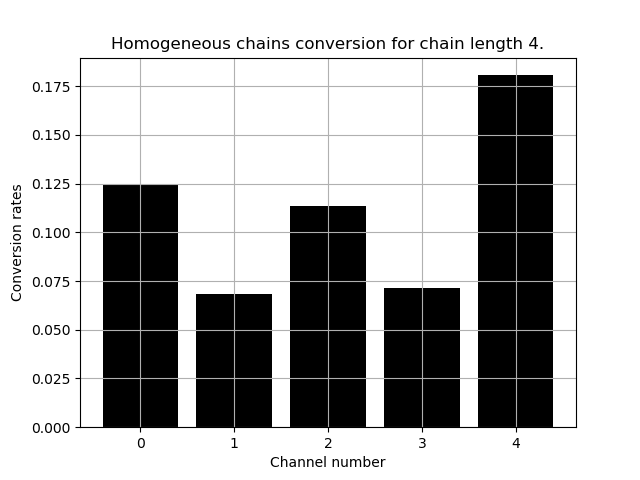
b) Conversion rate of homogeneous chains of specific channel
Fig.2.
A uniform chain appears as multiple instances of the same channel [1,1,1,1] or [2,2,2]. Whereas a diverse chain has multiple channels in any order [1,2,1,3] or [2,3,4,5]. A channel is deemed “diverse” when the number of unique channels in the chain divided by length is more than 0.5.
For example, chain [1,2,1,3] has length of 4 and 3 unique channels inside. Thus, 0.75 > 0.5, so it’s diverse.
As you see in the graphs, the most popular channel is not the most efficient one, and the efficiency of any uniform chain does not exceed 17.5%.
Graph a)
As you can see from the Fig. 2(a), channel 1 is the most popular.
So, if we have chain and are unsure which channels are in it, we can be pretty certain that channel 1 appears somewhere in the chain.
If channel 1 had the best conversion rate, we could attribute the increase of conversion rate in the diverse chains [1,2,3,4] to that channel.
Graph b)
However, Channel 1 is a uniform chain, with a mean conversion rate is 0.075 at Fig. 2(b), not 0.3, as it was on Fig. 1(b) which had 4 unique channels in the chain. This shows us that uniform chains convert three times less than diverse chains.
We can also say that the channel that appears most frequently isn’t necessarily the one with the highest conversion rate.
Because the conversion rate of a specific single channel or its popularity can’t account for the higher conversion rates found in diverse chains, it’s clear that the high results are based on channel interaction.
Evidence 2
We’ve used the available data to create a simple model that allows us to recalculate the probability of conversion without taking channel interactions into account. In the “interactionless” model simulation, we’ve got an overall conversion rate 0.3%.
We’ve also ran this simulation for two more different datasets for various chain lengths.
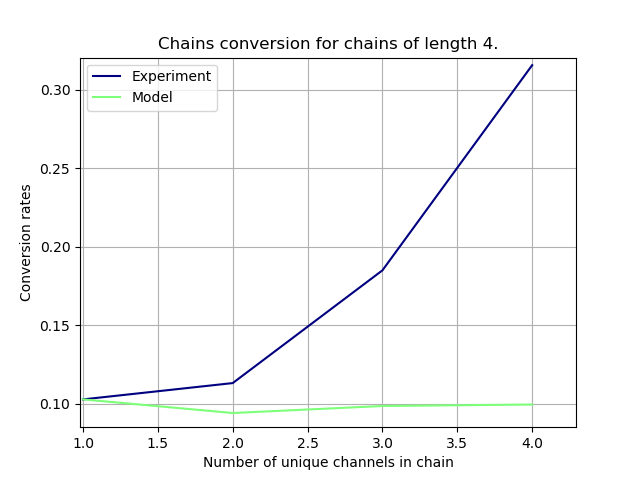
Dataset 1. Experiment(blue) vs. model(green)
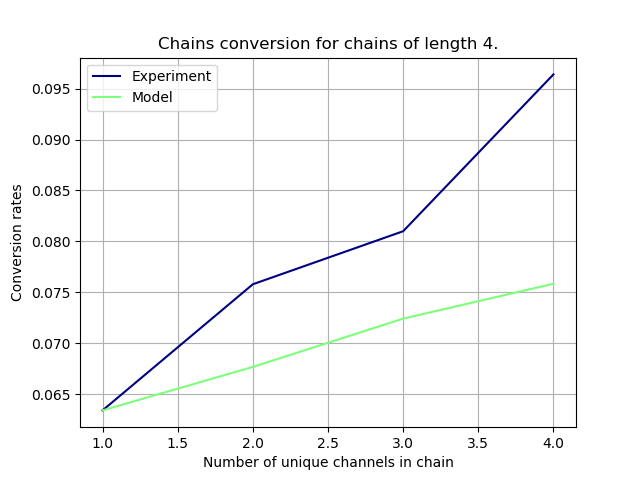
Dataset 2. Experiment(blue) vs. model(green)
Fig. 3.
The graphs for both data sets clearly show that a lack of channel interaction significantly reduces conversation rates.
So, the bottom line is that all data points to one clear fact: increasing the interaction between your marketing channels can give your conversion rates a major boost.
Going forward, you may want to consider which channels could you add to your marketing mix to give your users more touches.
Author: Alexander Bespalov, Research Data Analyst, Maxilect